Through games played on Jan. 21, 2024. AQs in bold. Last Four In in italics.
Last Four In: Cincinnati, Wake Forest, Colorado, Mississippi
First Four Out: Gonzaga, Syracuse, Oregon, Nevada
Next Four Out: Providence, Georgia, Texas, Ohio State
Through games played on Jan. 21, 2024. AQs in bold. Last Four In in italics.
Last Four In: Cincinnati, Wake Forest, Colorado, Mississippi
First Four Out: Gonzaga, Syracuse, Oregon, Nevada
Next Four Out: Providence, Georgia, Texas, Ohio State
Over winter break, I was fascinated by an article written by Will Warren (@statsbywill on Twitter) that used historic trends and stats to best pick the 2023 NCAA Tournament. I would recommend to take a read through if you're interested, and he also wrote articles for 2021 and 2022 (both of which are linked in his article), but his picks from 2023 particularly stood out to me, especially with context from what happened during the tournament.
While he did have Houston over Purdue in the national championship, his Final Four was rounded off by both San Diego State and UConn. Obviously, those two teams were in last year’s national championship, and having picked San Diego State over the likes of Alabama, Arizona, and Baylor was especially impressive to me. At the end, Will was essentially 3 picks away from having a great bracket. Some other picks throughout the article that particularly stood out for me were Arkansas over Kansas and Michigan State over Marquette.
After having read this article, I was inspired. Will spoke of a magical complete tournament data document, which I devoted hours recreating. I downloaded all of the Kenpom pre-tournament data since the 2001 season and plugged in tournament results in order to create a complete dataset which contains trends, statistics, and results from the previous 22 NCAA men’s basketball tournaments.
From there, I compiled rating systems and metrics in order to project the best possible selections, all while encompassing the trends that Will included in his article into one complete, customizable output. In order to validate the various outputs, I tested the rankings against the results of previous tournaments, all of which were highly successful in predicting some of the best selections. For example, the rating system correctly predicted 13 out of the Sweet Sixteen teams from the 2023 tournament, including perfect Sweet Sixteen matchups for the East (FAU, Tennessee, Kansas State, Michigan State) and the West (Arkansas, UConn, Gonzaga, UCLA) Regions.
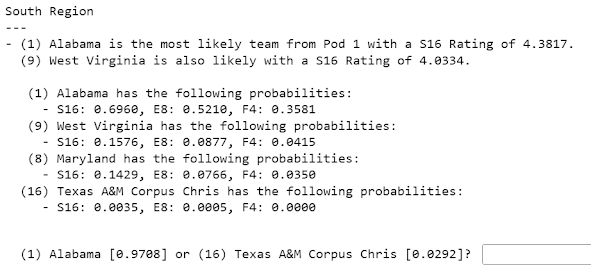
Here’s a sample of the output of the code using 2023 tournament data to better understand what we’re working with. For the 1st pod in the South Region, it outputs that both Alabama and West Virginia are good choices from the given pod. It also outputs the probability that each team in the given pod reaches the Sweet Sixteen, the Elite Eight, and the Final Four. Then, it prompts the user to make their selections for each game, including the probability that each team wins the given game. Using this example, Alabama had a 97 percent chance of beating Texas A&M-CC. The user is able to continue doing this until the bracket is completed, with various types of information throughout the output. At the beginning, a ranking of the most likely upsets based on historical trends is given and they’re also highlighted when the user has to select a team for these games. It also provides advice for selecting “toss-up games”, or games between 7- and 10-seeds, or 8- and 9-seeds.
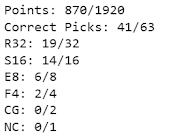
Obviously, no bracket will be perfect, even with this app. However, using this app as a supplement, I hope to be able to output selections that will put users (i.e., myself and some friends) in the best position to win bracket pools in March. We’ll see what happens in practice later in March, but since I’ve put in this work to create the project, I want to put it to use. So, every week, a couple days after my weekly bracket projection update, I intend on filling out my bracket using my app as a supplement, and then randomizing the results of the bracket to see how well I would do in a bracket pool.
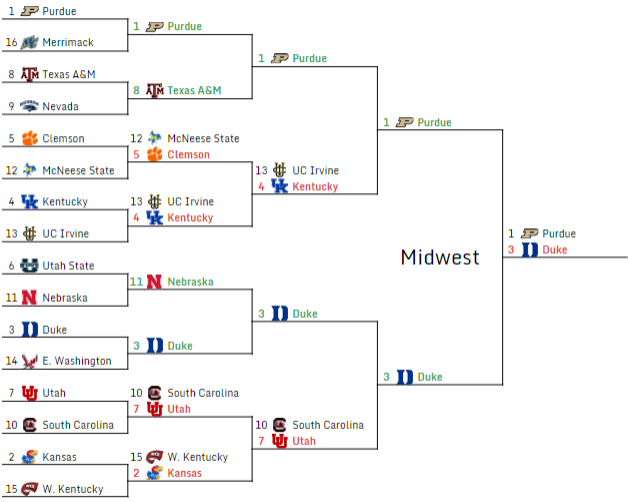
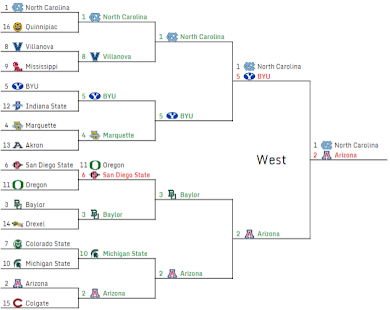
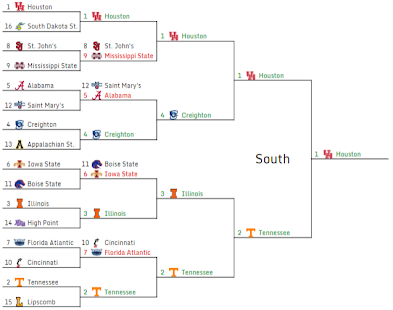
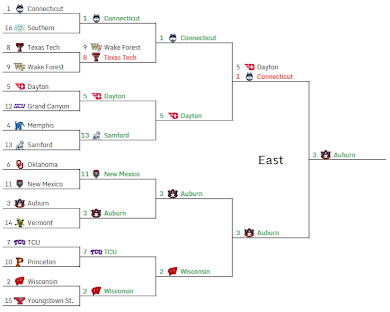
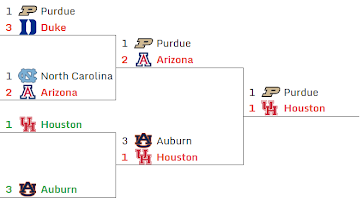
So, here’s the first edition. I’m linking the Google Sheet here with my bracket because it might be easier to look at, but I’m also adding images of each region as I break it down. As a bit of a key, every team that is on the line was my selection. Green means that I was right, red means that I was wrong, and the team above a team in red is the team that actually ended up winning that game.
Purdue vs. Texas A&M is an easy matchup. Nevada is worse than Texas A&M according to the rankings and Purdue is easily the best team in the pod. Surely nothing will go wrong this year… right? From there, the code actually triggers an upset alert for both Kentucky (9th most likely) and Clemson (4th most likely) in this pod, but I decide against it to play the numbers, and I end up failing both as a result. Kentucky and Clemson are given as the most likely teams from the pod with S16 ratings of 3.70 and 3.21 (out of 5), which should generally be a red flag that the algorithm isn’t too sure about this pod, which is exactly why I put Purdue to go through to the Elite 8 on the top side of the Midwest Region. Duke is the heavy favorite out of Pod 3, with a S16 rating of 5.26, so that’s an easy pick. Nebraska is the 3rd most likely upset, so I follow the algorithm with this one. According to the output, Utah is the most likely team from Pod 4, so that’s who I have for my S16 team. It ends up not mattering at all because I select the wrong R32 teams from this pod. Western Kentucky is flagged as the 12th-most likely upset from the field, so it was certainly a possibility. From there, I went with Purdue and Duke as my E8 teams, both of which had the best probabilities for their seeds. The algorithm actually told me to choose Purdue, but I decided to pick Duke under the assumption that many other brackets would likely select Purdue, meaning Duke would be a great value pick. Unfortunately, in this simulation, I clearly should’ve listened to the algorithm for the Midwest Region Winner.
Through games played on Jan. 14, 2024. AQs in bold. Last Four In in italics.
Last Four In: Seton Hall, Boise State, Northwestern, New Mexico
First Four Out: Ohio State, Florida, Miami FL, Texas
Next Four Out: Providence, Kansas State, Gonzaga, Colorado
Through games played on Jan. 8, 2024. AQs in bold. Last Four In in italics.
Last Four In: St. John's, Oregon, Miami FL, New Mexico
First Four Out: Nebraska, NC State, Virginia, Kansas State
Next Four Out: Northwestern, Wake Forest, Seton Hall, Butler
Not many changes, just decided to add my fix to my AQs.
Through games played on Jan. 7, 2024. AQs in bold. Last Four In in italics.
Last Four In: St. John's, Oregon, Miami FL, New Mexico
First Four Out: Nebraska, NC State, Virginia, Kansas State
Next Four Out: Northwestern, Wake Forest, Seton Hall, Butler
Last Four In: South Carolina, TCU, Texas Tech, Nebraska
First Four Out: Washington, Miami FL, Northwestern, Butler
Next Four Out: Arkansas, Kansas State, St. John's, St. Joseph's
By TSB Bracketology, November 27, 2023
Big Ten basketball is upon us. Our Boilers start off the conference season with a game against Northwestern on December 1st and follow it up with the home opener the Monday after against Iowa on December 4th. Other notable matchups this week include Michigan State-Wisconsin, and Indiana-Michigan, which should be compelling matchups this early in the season.
Coming off of a strong week of MTEs with Feast Week, we’re going to take a look at how the Big Ten season may shape up by using KenPom Efficiency Data to form our forecasts. Before this interlude of Big Ten matchups, we’re also going to compare projections from data from the beginning of the season and projections from the most updated KenPom numbers. In doing so, we’re going to see how projections have changed already in this short season and have a better understanding of what could be to come for the upcoming conference season.
KenPom’s ratings can be used to predict the outcome of future games, but, for forecasting purposes, we’ll be using the data in order to calculate win probabilities. With the win probabilities, we can effectively assign wins to teams based on randomly generated numbers ranging from 0 to 1, with each number corresponding to the result of the simulated game. For example, if a home team in a matchup had a win probability of 58 percent and the randomly generated number was less than or equal to 58, then the home team would be assigned a win.
If we repeat this process for all 140 Big Ten conference games and we assume that all of the games are independent events, then we can complete a simulation for the upcoming conference slate. Running through 10,000 simulations of the Big Ten season, we can get decently accurate forecasts for the probability that a team reaches a certain threshold of wins across the season. We can also get fairly precise numbers for a given team’s projected wins for the season.
The decision to include every single conference game in a simulation was made in order to ensure accuracy for the probabilities that the teams have to win the Big Ten regular season title. The individual win probabilities and the expected win totals for each team could have been collected by simulating a team’s conference schedule individually (e.g., only Purdue’s schedule, only Illinois’ schedule, etc.), and the subsequent numbers would be the same, if not very similar to, the resulting numbers.
However, in order to obtain title forecast numbers from simulations for individual teams, teams would be compared by randomly generating the wins based on the win probabilities for the team, and the team (or teams) with the most conference wins in a simulation would be given the title. The issue with this method is the sum of all of the simulated win totals could be above or below the 140 conference games since results are not decided game by game, which means that both teams for a given game could be unknowingly given a win or a loss. By including every single conference in a simulation, we ensure more accurate regular season title probabilities.
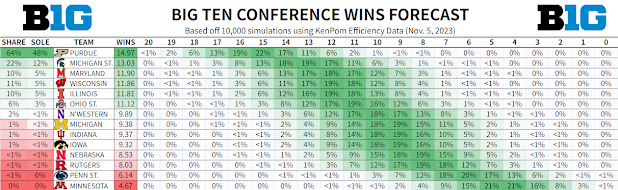
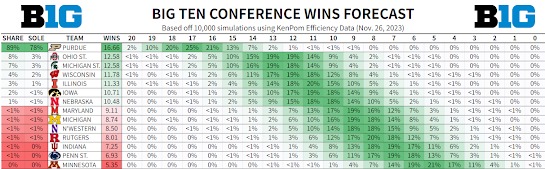
With the bulk of the methodology explained, let’s dig into the initial numbers. The projected wins for each team from the preseason data were largely consistent with what was expected from the media. At the beginning of the season, Purdue was the clear favorite for the Big Ten regular season crown at about 15 wins, with Michigan State expected to be elite competition for the Boilermakers with an average of just about 13 wins. Wisconsin, Maryland, and Illinois were expected to be competitive at about 12 conference wins each, with each team having about a 10 percent chance for at least a share of the title and a 5 percent chance at sole position of the title. Penn State at about 6 wins and Minnesota at about 5 wins were expected to be the bottom dwellers of the conference, while the rest of the teams filled out the rest of the standings, averaging anywhere between 8 to 11 conference wins.
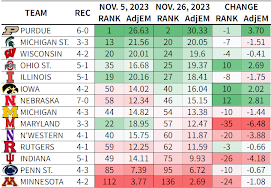
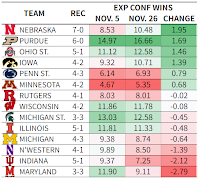
However, as the season has progressed, these projections have fluctuated, just as KenPom’s efficiency numbers have fluctuated as well. Purdue had the largest jump in Efficiency ratings after a Maui Invitational tournament win that included wins against Gonzaga, Tennessee, and Marquette. In fact, at one point, Purdue had 5 of the top 8 KenPom teams on their schedule, showing just how difficult their non-conference schedule has been. Nebraska has jumped 12 positions in the KenPom rankings after a hot start against lesser opponents, while Ohio State’s upset win over Alabama in the Emerald Coast Classic catapulted them up in the rankings. Even with losses to Creighton and Oklahoma, Iowa’s dominant wins over North Dakota and Alabama State have moved them up as well.
For the most part, most other Big Ten teams have had a tough non-conference schedule. Maryland was the largest falling team, having been upset by Davidson and UAB, and dominated by Villanova. Even though Indiana has only lost one game to UConn, they have largely struggled in all of their other games, as Florida Gulf Coast, Army, Wright State, and Harvard have proved difficult opponents for the Hoosiers. Northwestern hasn’t lived up to preseason expectations, and even Michigan State has dropped a little bit, after an opening night upset at home against James Madison, and having lost two neutral games to Duke and Arizona.
After only three weeks of basketball so far, Purdue has run away with the forecasted Big Ten title. With an 89 percent chance of at least a shared title, the Boilermakers is the team to beat not only in the Big Ten, but across the nation. The expected ~17 wins for Purdue is miles above any other conference foe, and the team has about a 2 percent chance to go undefeated in the Big Ten according to the current data. Of course it’s still a long shot for the Boilers to finish unbeaten in the Big Ten, but even still, Purdue will be a huge mountain to climb for any opponent (literally and figuratively with Zach Edey on the court), especially in Mackey Arena.
Aside from Purdue, the rest of the teams have more or less been broken up into three separate tiers. There’s the better half that is composed of Ohio State, Michigan State, Wisconsin, Illinois, Iowa, and Nebraska. Then, there’s the worse half with Maryland, Michigan, Northwestern, Rutgers, Indiana, and Penn State. And then there’s still Minnesota towards the bottom.
Ohio State and Michigan State actually ended up with the same amount of conference wins to the hundredths place with the efficiency data at this point in the season, but the teams have gotten to this number in different ways. At 5-1, Ohio State probably has the best resume in the conference behind Purdue. The Buckeyes have a very strong neutral site win over Alabama and a close home loss to a good Texas A&M team. On the other hand, Michigan State currently sits at 3-3 and has had tough opponents in Duke, Arizona, and apparently James Madison. The schedule for the Spartans doesn’t get much easier, with a gritty Wisconsin team, a hot Nebraska team, and Baylor in coming weeks. Even so, Coach Izzo always seems to find a way every season, and if Tyson Walker can get some consistent help offensively, Michigan State will be a scary team come March.
The biggest thing to gather from this forecast is how much parity there is in this league. Aside from Purdue at the top and Minnesota at the bottom, teams have shuffled in and out of projected positions as the short season has gone on. At the beginning of the season, Maryland was near the top at about 12 expected wins, but now sits in the very middle at a projected conference record of 9-11. Wisconsin has stayed about stable from these two forecasts, but they have only recently moved back up to the upper echelon of the projected standings after their wins over Virginia and SMU in Fort Myers. Nebraska moved up nearly 2 whole conference wins since the start of the season, but has only moved from 11th to 7th. There really is no predicting just which way the Big Ten season will take us.
Of course, both of these forecasts are preliminary and teams go on hot and cold streaks throughout the season. Even with Big Ten conference games this weekend, many teams still have tough non-conference opponents coming up too. At the end of the day, these projections should only be used to gather a general understanding of the expectations for each team at this stage. All in all, I am very excited for the start of Big Ten basketball and very interested to see how accurate these forecasts end up.