Over winter break, I was fascinated by an article written by Will Warren (@statsbywill on Twitter) that used historic trends and stats to best pick the 2023 NCAA Tournament. I would recommend to take a read through if you're interested, and he also wrote articles for 2021 and 2022 (both of which are linked in his article), but his picks from 2023 particularly stood out to me, especially with context from what happened during the tournament.
While he did have Houston over Purdue in the national championship, his Final Four was rounded off by both San Diego State and UConn. Obviously, those two teams were in last year’s national championship, and having picked San Diego State over the likes of Alabama, Arizona, and Baylor was especially impressive to me. At the end, Will was essentially 3 picks away from having a great bracket. Some other picks throughout the article that particularly stood out for me were Arkansas over Kansas and Michigan State over Marquette.
After having read this article, I was inspired. Will spoke of a magical complete tournament data document, which I devoted hours recreating. I downloaded all of the Kenpom pre-tournament data since the 2001 season and plugged in tournament results in order to create a complete dataset which contains trends, statistics, and results from the previous 22 NCAA men’s basketball tournaments.
From there, I compiled rating systems and metrics in order to project the best possible selections, all while encompassing the trends that Will included in his article into one complete, customizable output. In order to validate the various outputs, I tested the rankings against the results of previous tournaments, all of which were highly successful in predicting some of the best selections. For example, the rating system correctly predicted 13 out of the Sweet Sixteen teams from the 2023 tournament, including perfect Sweet Sixteen matchups for the East (FAU, Tennessee, Kansas State, Michigan State) and the West (Arkansas, UConn, Gonzaga, UCLA) Regions.
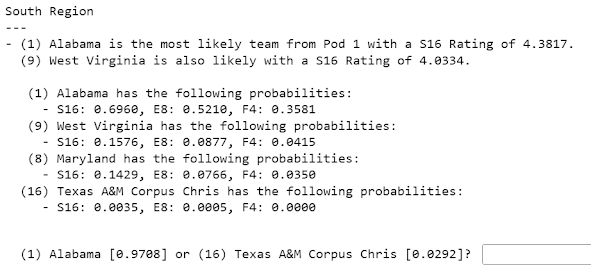
Here’s a sample of the output of the code using 2023 tournament data to better understand what we’re working with. For the 1st pod in the South Region, it outputs that both Alabama and West Virginia are good choices from the given pod. It also outputs the probability that each team in the given pod reaches the Sweet Sixteen, the Elite Eight, and the Final Four. Then, it prompts the user to make their selections for each game, including the probability that each team wins the given game. Using this example, Alabama had a 97 percent chance of beating Texas A&M-CC. The user is able to continue doing this until the bracket is completed, with various types of information throughout the output. At the beginning, a ranking of the most likely upsets based on historical trends is given and they’re also highlighted when the user has to select a team for these games. It also provides advice for selecting “toss-up games”, or games between 7- and 10-seeds, or 8- and 9-seeds.
Obviously, no bracket will be perfect, even with this app. However, using this app as a supplement, I hope to be able to output selections that will put users (i.e., myself and some friends) in the best position to win bracket pools in March. We’ll see what happens in practice later in March, but since I’ve put in this work to create the project, I want to put it to use. So, every week, a couple days after my weekly bracket projection update, I intend on filling out my bracket using my app as a supplement, and then randomizing the results of the bracket to see how well I would do in a bracket pool.
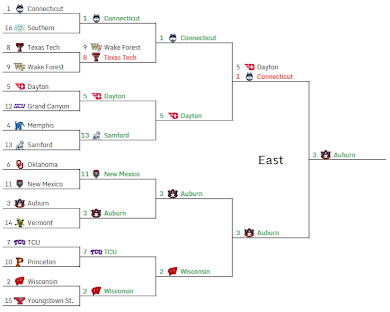
So, here’s the first edition. I’m linking the Google Sheet here with my bracket because it might be easier to look at, but I’m also adding images of each region as I break it down. As a bit of a key, every team that is on the line was my selection. Green means that I was right, red means that I was wrong, and the team above a team in red is the team that actually ended up winning that game.
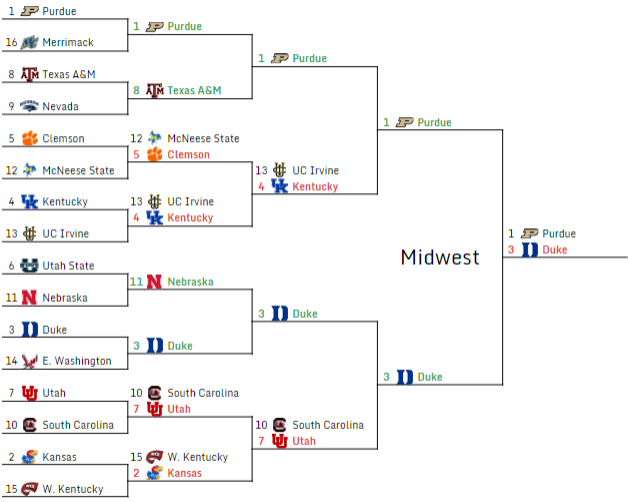
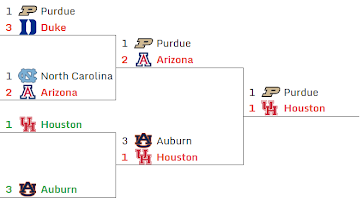
Purdue vs. Texas A&M is an easy matchup. Nevada is worse than Texas A&M according to the rankings and Purdue is easily the best team in the pod. Surely nothing will go wrong this year… right? From there, the code actually triggers an upset alert for both Kentucky (9th most likely) and Clemson (4th most likely) in this pod, but I decide against it to play the numbers, and I end up failing both as a result. Kentucky and Clemson are given as the most likely teams from the pod with S16 ratings of 3.70 and 3.21 (out of 5), which should generally be a red flag that the algorithm isn’t too sure about this pod, which is exactly why I put Purdue to go through to the Elite 8 on the top side of the Midwest Region. Duke is the heavy favorite out of Pod 3, with a S16 rating of 5.26, so that’s an easy pick. Nebraska is the 3rd most likely upset, so I follow the algorithm with this one. According to the output, Utah is the most likely team from Pod 4, so that’s who I have for my S16 team. It ends up not mattering at all because I select the wrong R32 teams from this pod. Western Kentucky is flagged as the 12th-most likely upset from the field, so it was certainly a possibility. From there, I went with Purdue and Duke as my E8 teams, both of which had the best probabilities for their seeds. The algorithm actually told me to choose Purdue, but I decided to pick Duke under the assumption that many other brackets would likely select Purdue, meaning Duke would be a great value pick. Unfortunately, in this simulation, I clearly should’ve listened to the algorithm for the Midwest Region Winner.
No comments:
Post a Comment